The rich are still there
Capitalism is a class-divided society in which a minority own and control the  means of production while the majority are forced by economic necessity to work for a wage or a salary in order to live.
Whatever may have been the case at an earlier stage of capitalism, nowadays ownership of the means of production does not take the form of personal possession, management and appropriation of profit, but that of a legal right to draw an unearned income derived from their operation. The most obvious case of this are stocks and shares.
But since any income is a claim on wealth and since wealth can only be produced by humans working on materials that originally came from nature, all forms of unearned income are ultimately derived from the operation of the means of production and so represent a stake in their ownership even if no direct link can be established with a particular factory or mine or railway or whatever. Interest-bearing bank or building society accounts, and government bonds and National Savings, are, like stocks and shares, property rights over the means of production.
So, in modern capitalism, minority ownership of the means of production is not going to be a case of the minority personally possessing as their exclusive private property all land, factories and other workplaces, but of them having a disproportionate share of legal titles conferring the right to draw an unearned, or property, income from the operation of the means of production as a whole. What the statistics can be expected to show is not 1.2 or 5 percent owning 100 percent of unearned income yielding rights, but a range from those having little or no stake in the ownership of the means of production, through those having modest stakes of varying sizes, to those at the top end with stakes large enough to provide an income sufficient to free them from the necessity of going out and working for a wage or salary.
What the statistics show
So what are the statistics and what do they show? Ever since Sir William Harcourt introduced death duties in the budget of 1894, the Inland Revenue has possessed the raw data for working out the distribution of property and property rights in Britain. Once you know how much, and what type of wealth, people leave in their wills it is possible to estimate what and how much those who are alive own:
Briefly, the Inland Revenue collects information about the value of estates and. by applying factors based on inverse mortality tables, derives estimates of the wealth of the living . . . A number of adjustments have to be made in the course of deriving these estimates: some asset valuations have to be converted to values which are more appropriate to the wealth of the living; as no information is available on holdings of some jointly-owned property which would pass on death to the surviving joint owner, this data has to be imputed using limited data available from other sources; similarly, imputations are required for property held in some trusts and for the holdings of the smallest estates which do not require a grant of representation when passing on death. (Economic Trends. November 1991).
The results of these calculations are published each year in the annual Inland Revenue Statistics. The latest edition, that for 1991, came out in January. The provisional figures for the year 1989 are given in Table 1.
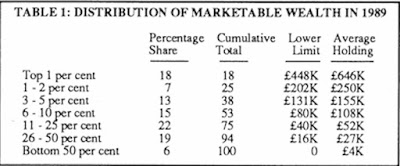
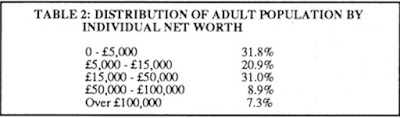
This is the source of the figure quoted in the press at the time of the top 1 percent owning 18 per cent and the top 10 percent owning 53 percent of all “marketable wealth”. The figures also reveal (see Table 2) how lacking in wealth are the vast majority of the population: 83.7 percent own wealth worth less than £50,000. while 52.7 percent own less than £15,000 and 31.8 per cent less than £5000.
But revealing as these figures are, they are not those we are looking for since “marketable wealth” is precisely what the term suggests: wealth of any kind owned by an individual and which they could dispose of for cash. To measure the unequal stake people have in the ownership of the means of production what is relevant is not all wealth but only those forms that confer the right to pocket an unearned income. The ownership of means of consumption such as houses, cars and household goods needs therefore to be excluded. These in fact form a fairly high proportion of marketable wealth.
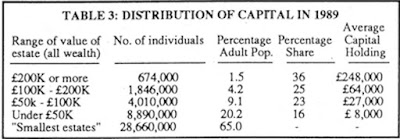
Distribution of capital
Unfortunately the figures quoted above are not broken down by type of asset, but the raw Inland Revenue data after application of the mortality tables are. The figure for this—called “identified personal wealth”—is somewhat less than the final adjusted figures as it excludes in particular any wealth owned by adults whose wealth holding is too small to have to be declared to the tax authorities (this applies in fact to 65 percent of adults) and also the wealth held in the trusts which are a favourite tax-avoiding device employed by the rich. In 1989 identified personal wealth amounted to only 65 percent of total marketable wealth.
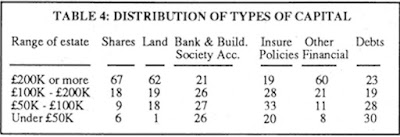
What these figures show is that 46 percent of personal wealth takes the form of residential buildings and 8 percent of household goods, cars and other personal possessions, making a total of 54 percent. It is the distribution of the remaining 46 percent—consisting of stocks and shares, bank and building society accounts, insurance policies, government bonds and other financial assets, and land and non-residential buildings—that interests us since, as assets yielding an unearned financial income, they are forms of wealth that confer a stake in the ownership of the means of production. They are capital in the sense of wealth that is invested to obtain an unearned income, whether profits, dividends, interest or ground-rent.